
How does labour force participation vary across Indian states?

Some of India’s smaller states such as Sikkim, Himachal Pradesh, and Nagaland had the highest labour force participation rate (LFPR) in 2022-23. They also had higher female LFPR.
Key highlights
- In 2022-23, Sikkim had the highest LFPR, with 76.6 percent of its population employed or looking for work and Bihar had the lowest LFPR among all states, with only 49.7 percent.
- There is a significant gender gap in LFPR, with 82.1 percent of men participating in the labour force compared to only 34.1 percent of women. Among the states, Assam had the widest gender gap, while Sikkim had the narrowest.
- Bihar had the smallest share of its workforce engaged in wage/salaried employment, while Goa and Kerala had the highest shares of workforce engaged in wage/ salaried employment.
- Among those who were self-employed, Goa and Kerala had the highest proportion of employers in 2022-23 (23 and 22 percent of self-employed individuals), Chhattisgarh had the highest proportion of unpaid helpers (45.5 percent) and Manipur had the highest share of own-account workers (86.7 percent).
- Assam had the highest share of workers engaged in casual labour (33.8 percent), while Nagaland, Mizoram, Arunachal Pradesh, and Manipur had the lowest share.
Indian states stand out for their diversity across metrics and labour force participation is no different. Data from the latest Periodic Labour Force Survey (PLFS) shows that the labour force participation rate (LFPR) in India in 2022-23 was 58.3 percent among those aged between 15 and 59 years. The LFPR includes those who were engaged in economic work or were looking for work but were unemployed. For rural India, the LFPR was 59.9 percent, while in urban India, the LFPR was 54.2 percent.
In this analysis, we look at how the LFPR varied across different states in 2022-23. The analysis is based on data from various rounds of the PLFS by the National Sample Survey Office (NSSO)). We use the current weekly status as the reference period for calculating the estimates.

The survey shows that some of India’s smallest states by population recorded the highest LFPR in 2022-23. Sikkim topped the list, with 76.6 percent of its working age population part of the labour force, followed by Himachal Pradesh, Nagaland, Meghalaya, and Arunachal Pradesh.
At the bottom of the pile were states that had a large population or those where agriculture is the dominant economic activity. Bihar had the lowest LFPR among all states, with only 49.7 percent of its population employed or looking for work in 2022-23. Haryana, Uttar Pradesh and Jharkhand had the next lowest rates of labour force participation, respectively (Figure 1).
When it comes to LFPR in rural areas, Sikkim had the highest LFPR and Bihar had the lowest. The urban LFPR was the highest for Nagaland, and the lowest in Bihar.
Gender gaps in labour force participation
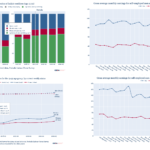
As CEDA has reported previously, there was a wide gap in the LFPR for men and women – while 82.1 percent men were part of the labour force, only 34.1 percent women were working or looking for work.
These gaps exist at the state level too, with some states having wider gaps than others (Figure 2). There is also much more variation in female LFPR rates than in male LFPR among states.
For men, the highest LFPR was recorded in Assam (92.6 percent) in 2022-23, and the lowest was in Mizoram (73.7 percent), a gap of 18.9 percentage points. For women, the highest LFPR was recorded in Sikkim (69.5 percent), while Assam had the lowest LFPR (17.8 percent) – a gap of 51.7 percentage points.
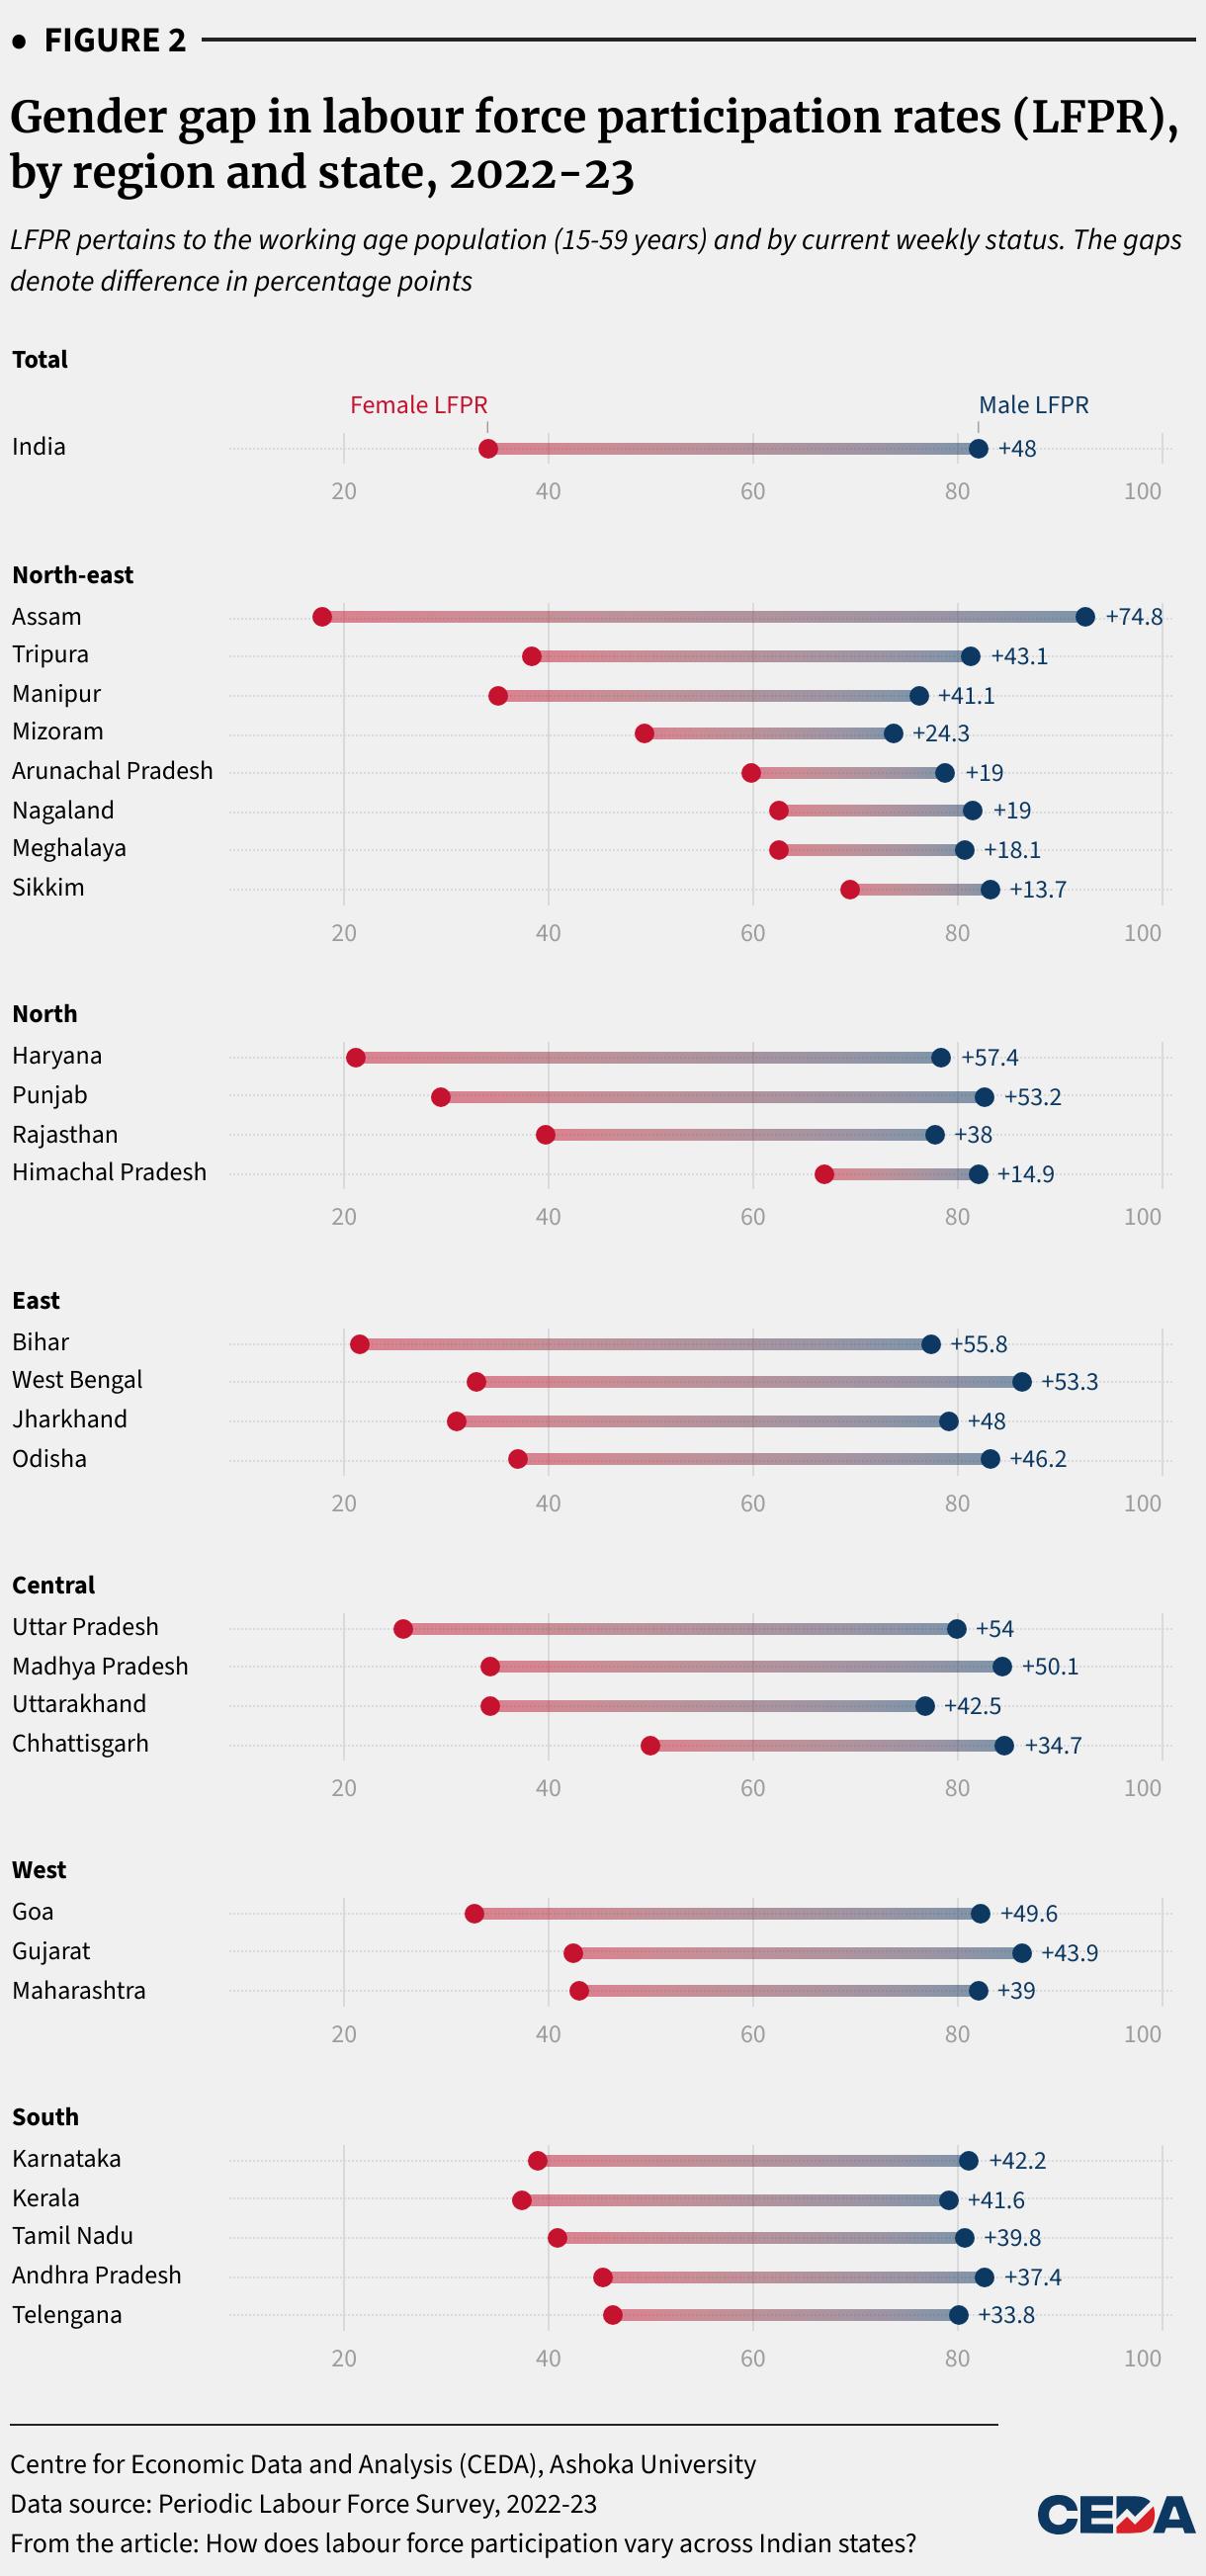
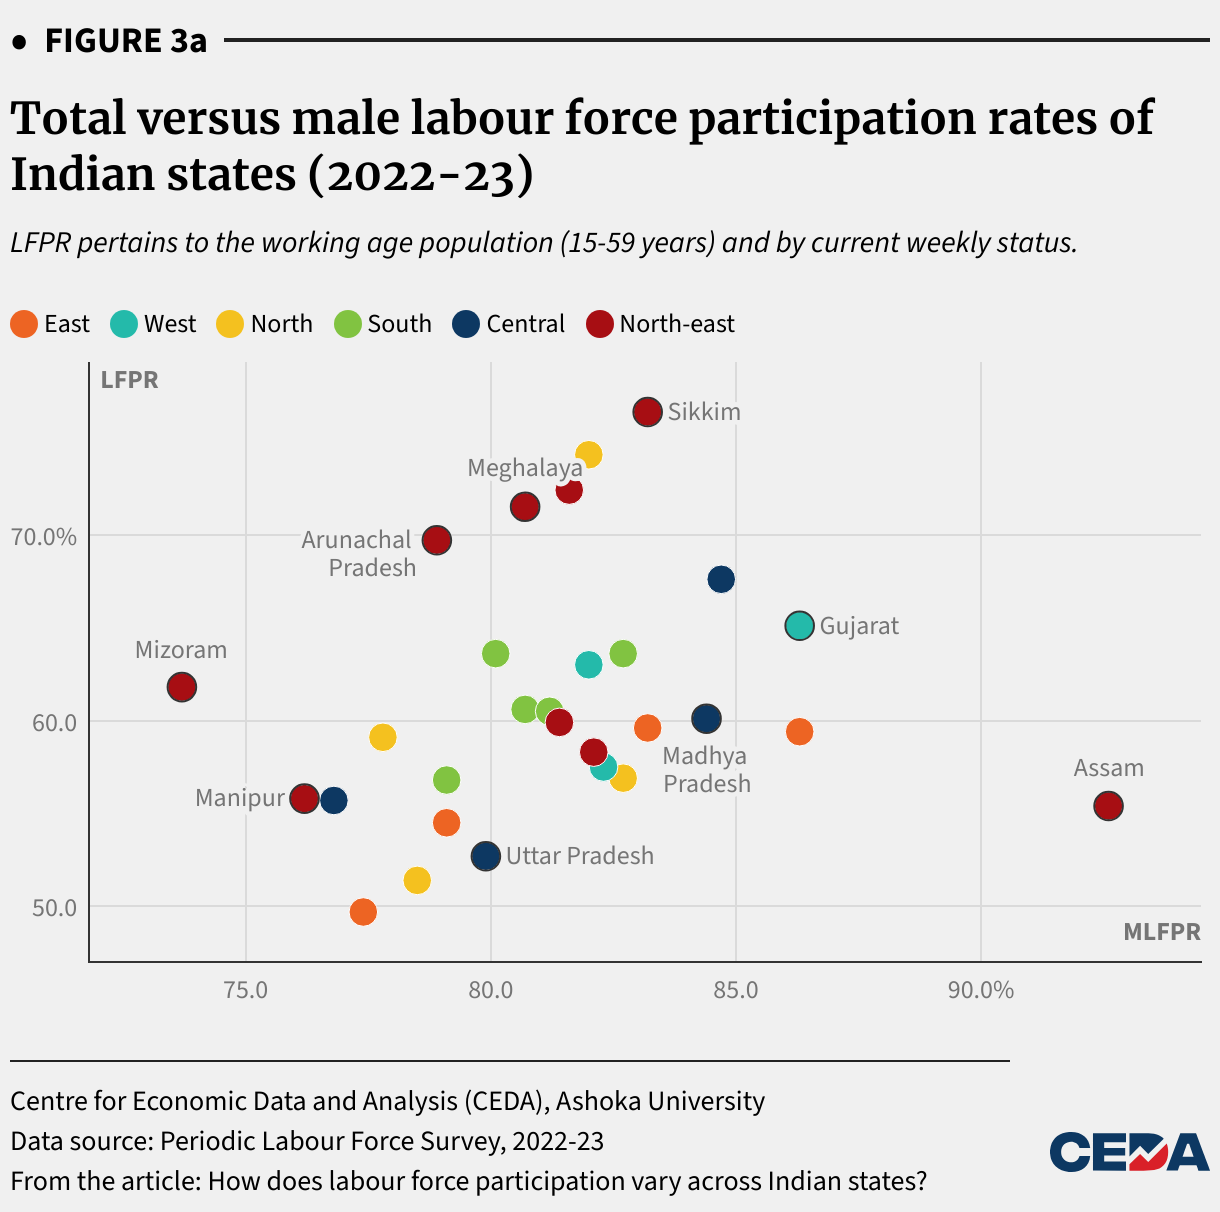
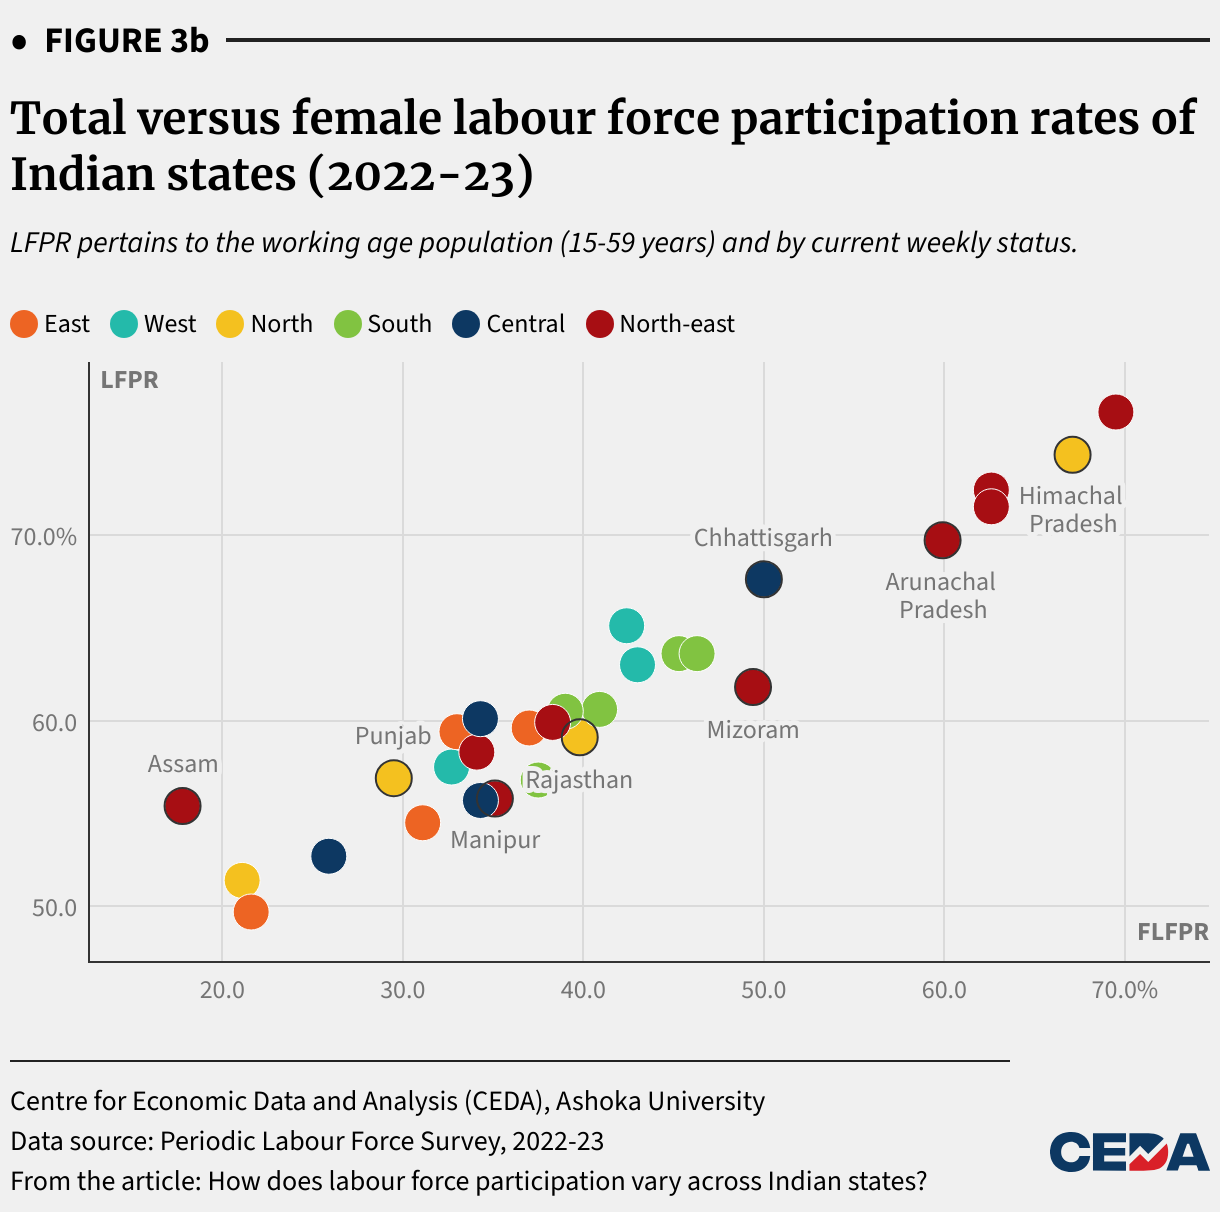
Assam had the widest gap (74.8 percentage points) among the LFPR of men and women, followed by Haryana (57.4 percentage points) and Bihar (55.8 percentage points), while Sikkim had the narrowest gap (13.7 percentage points). Consequently, states with higher rates of female labour force participation are also the states with higher rates of overall labour force participation (Figure 3).
Patterns in divisions of the workforce – casual labour, self-employment and wage/salaried employment
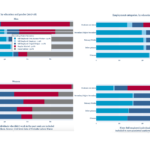
PLFS divides the workforce in three broad segments—those engaged in casual labour, self-employed people, and those working for regular wages and salaries.
The survey showed that over half (54.4 percent) of India’s workforce was self-employed in 2022-23 (Figure 4). A little under a quarter (23.8 percent) were engaged in wage and salaried work, while the rest (22 percent) worked as casual labourers.

These patterns were similar for both genders, but women were more likely to be self-employed than men. In rural India, workers were most likely to be self-employed, followed by working as casual labourers, and least likely to be working in wage and salaried work. In urban areas, however, most people work for salaries, followed by self-employment and casual labour.
Most states followed a similar trend, with the largest share of their workforces engaged in self-employed work. However, there were deviations from the national trends, and the following sections explore these in detail:
Wage and salaried employment
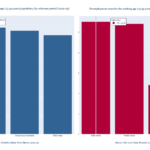
There are three states where the share of people engaged in regular, salaried work is higher than the proportion of self-employed people and those on casual labour—Goa with 61.1 percent, Kerala with 41.2 percent and Tamil Nadu with 35.7 percent.
This is mainly because more than half of the rural workforce (56.8 percent) in Goa and more than a third of the rural workforce (35.1 percent) in Kerala, along with urban, was engaged in salaried work in 2022-23, the highest for rural areas across all states and significantly higher than the national average of 14.2 percent. Haryana had the next highest share of the workforce engaged in wage and salaried work (40.3 percent), followed by Punjab (with 36.6 percent).
Bihar was at the bottom of this list. Barely 9.5 percent of its workers were engaged in wage and salaried employment—7.7 percent in rural areas and 30.9 percent in urban areas. Bihar was followed by Assam and Uttar Pradesh with 11.5 percent and 15 percent of their workforces employed in regular wage employment.
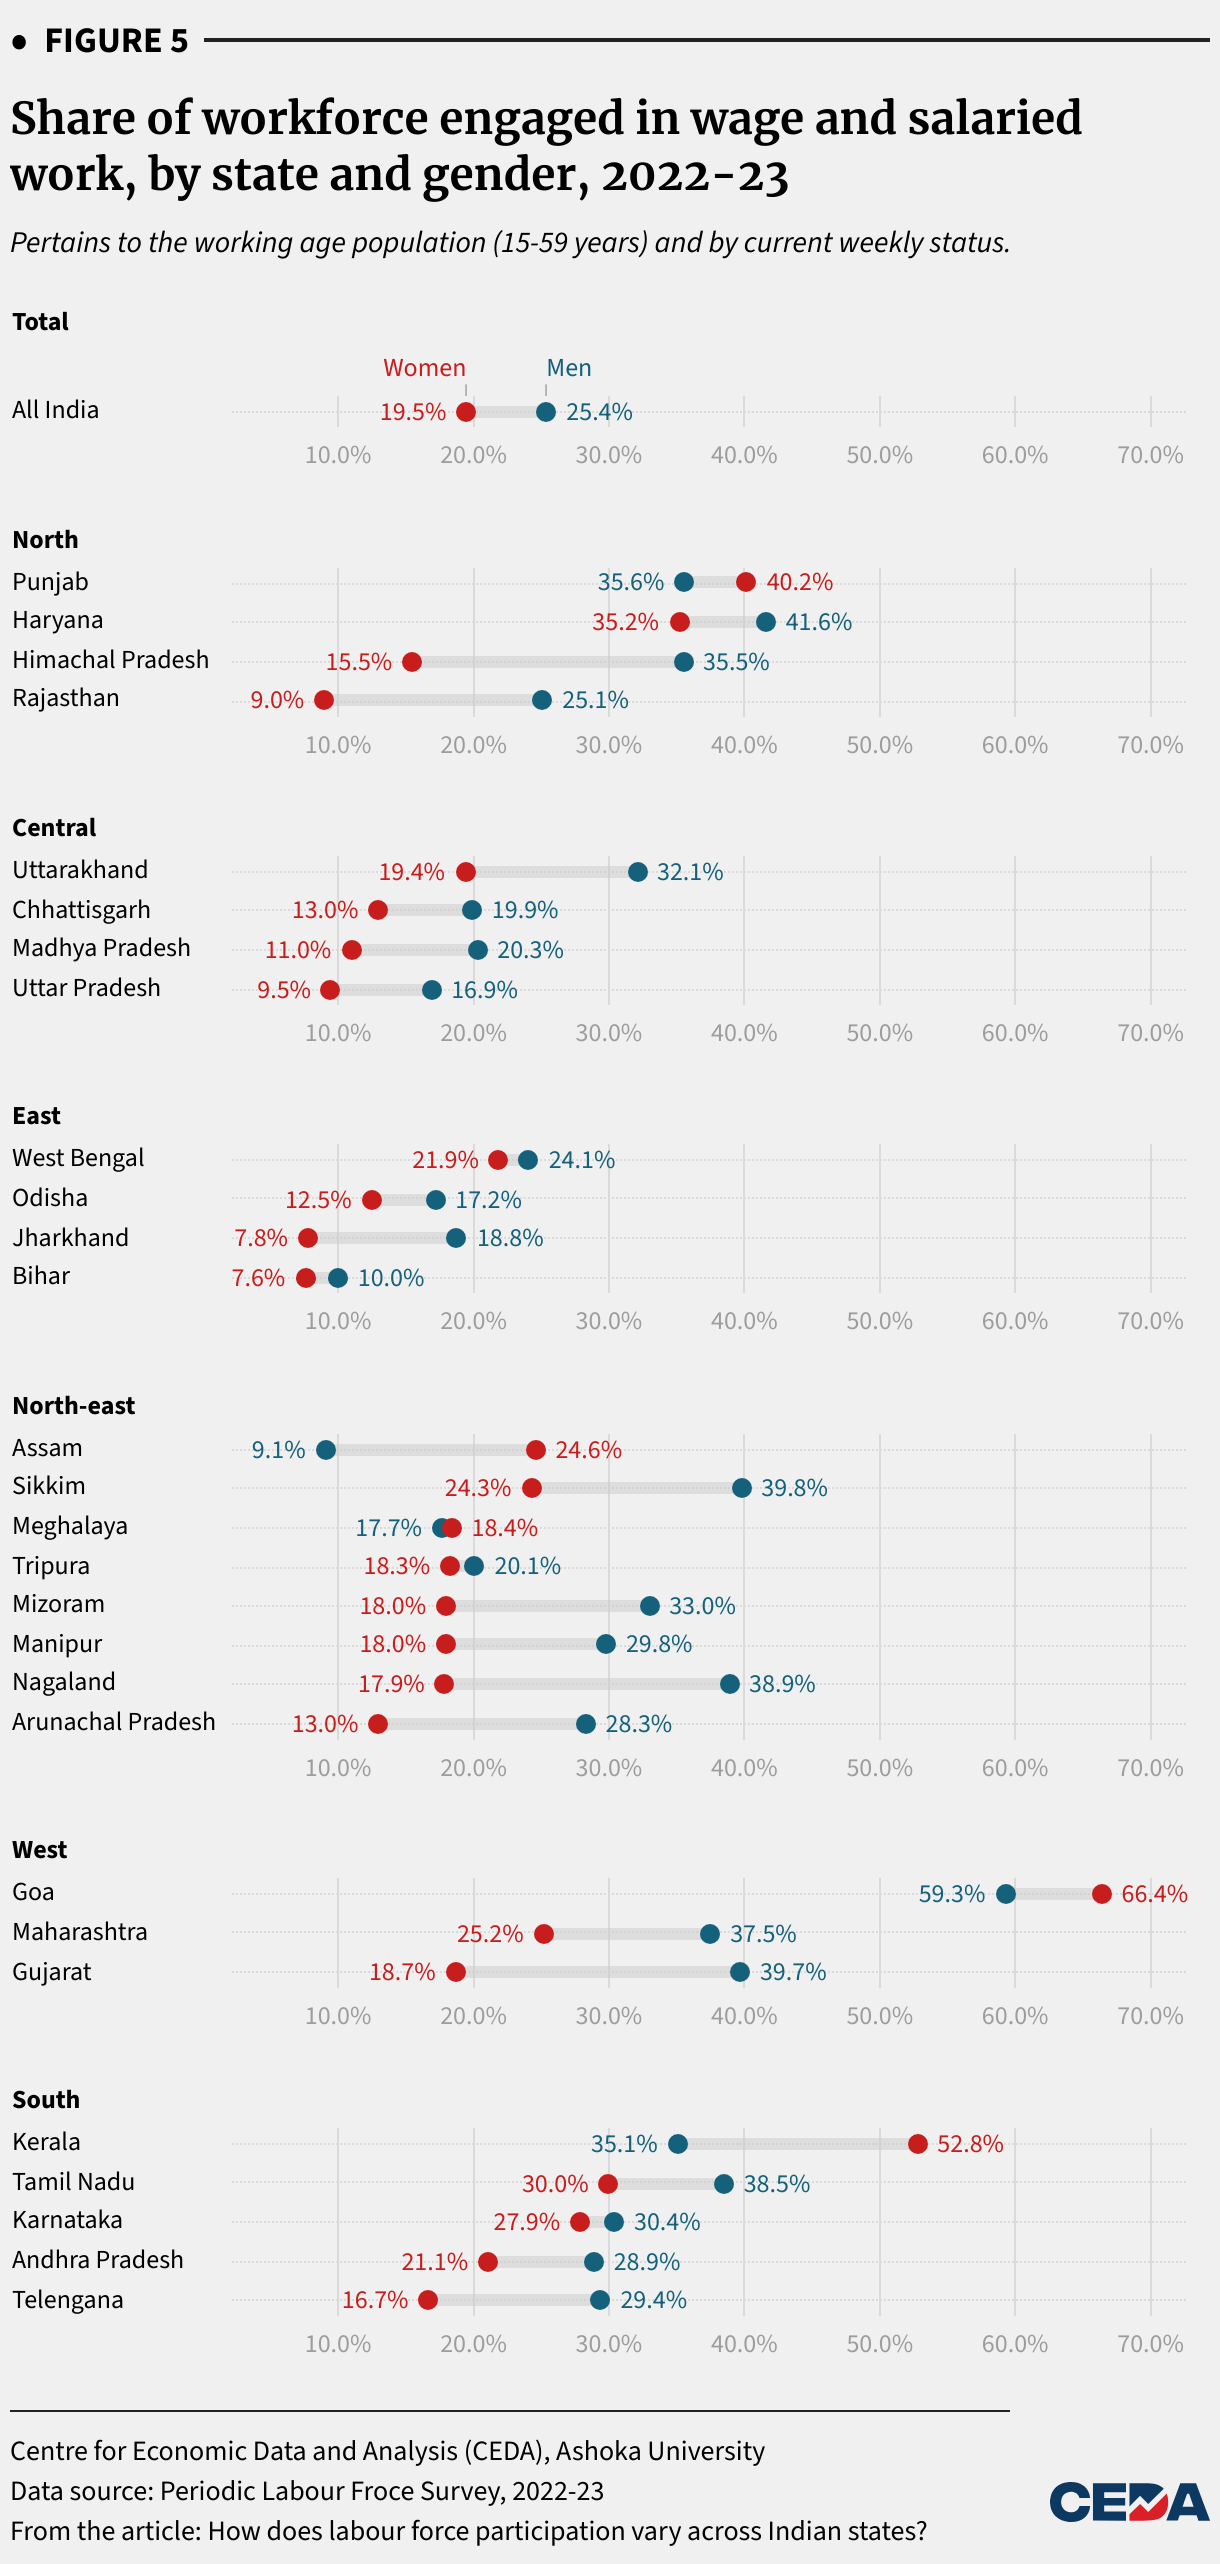
Across India, 25.4 percent of men and 19.5 percent of women were engaged in salaried employment. This varied from 9.1 percent in Assam to 59.3 percent in Goa for men, and from 7.6 percent in Bihar to 66.4 percent in Goa for the female workforce (Figure 5).
Workforce engaged in casual labour
The share of the workforce engaged in casual labour in India is 22 percent. The share of casual labour is higher in rural areas (25.4 percent) than urban areas (11.8 percent), and higher for men as compared to women.
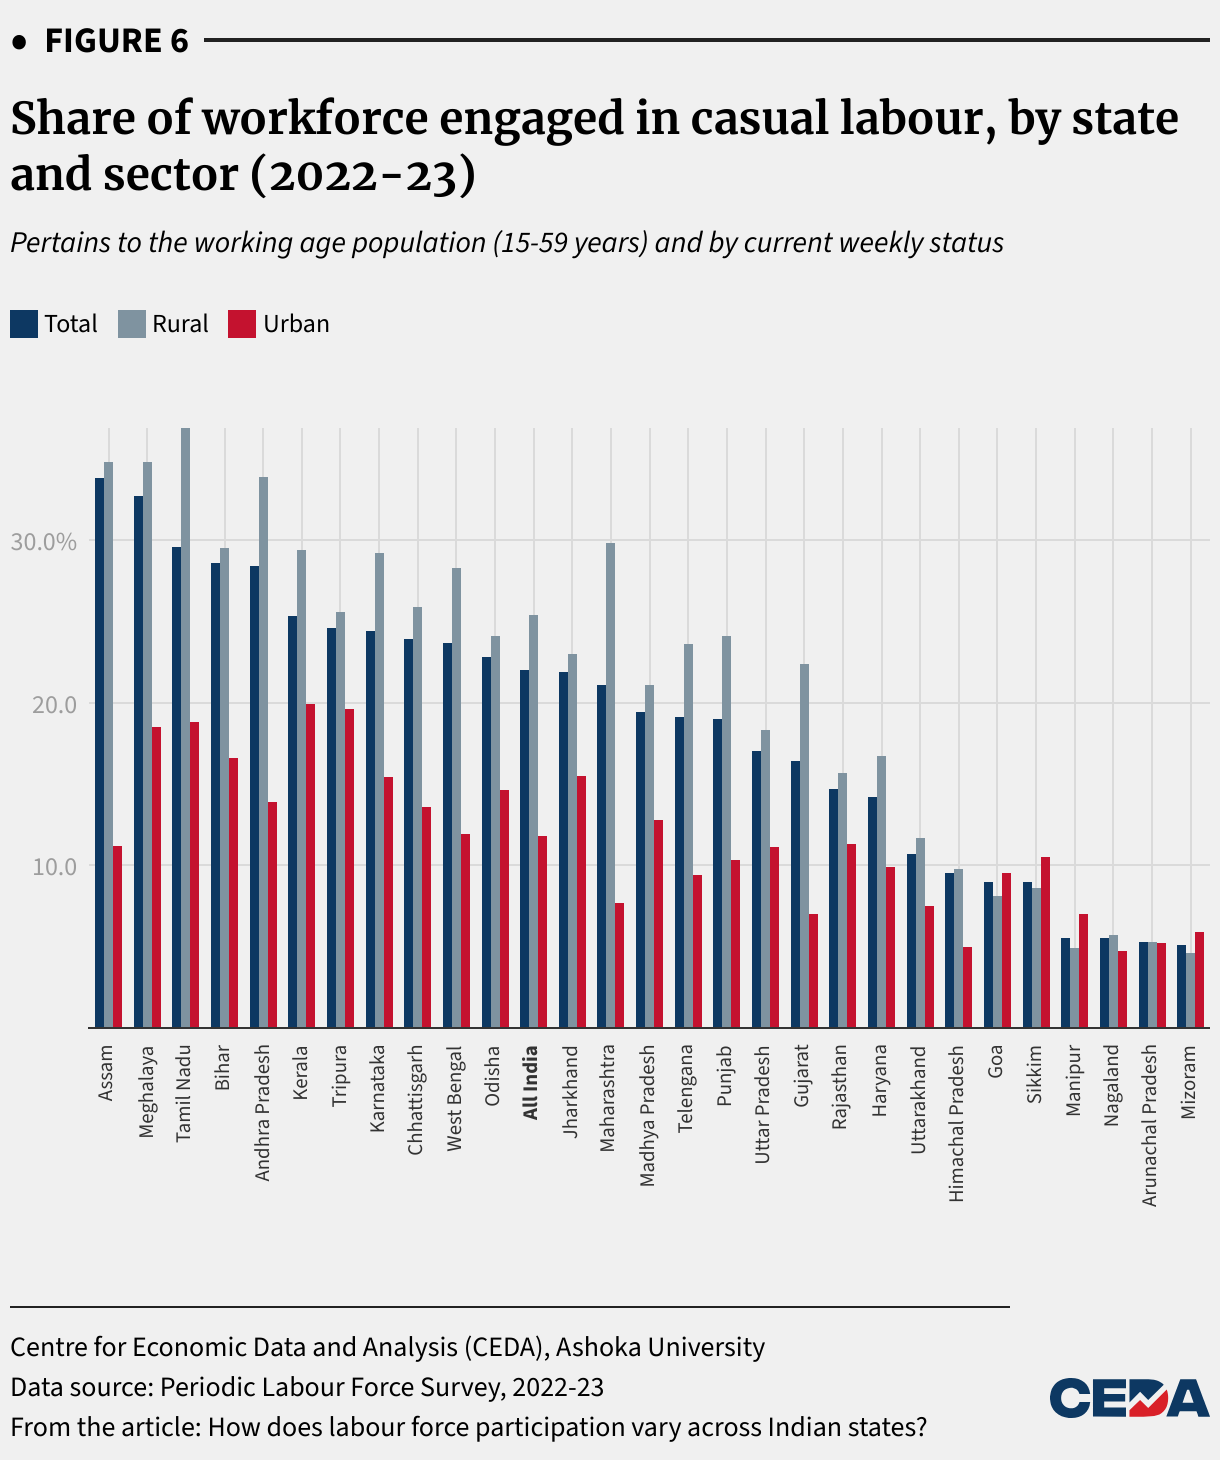
A third (33.8 percent) of the workforce in Assam was engaged in casual labour in 2022-23, the highest among all states, followed by Meghalaya and Tamil Nadu with 32.7 percent and 29.6 percent, respectively.
In rural areas, Tamil Nadu has the highest share of casual labour at 36.9 percent, followed by Meghalaya and Assam with 34.8 percent each. In urban areas, while Tamil Nadu and Meghalaya have high rates of casual labour, 18.8 and 18.5 percent, respectively, Assam’s share is lower than the national rate, at 11.2 percent.
All three states have high shares of male casual labour—Meghalaya with 38.9 percent, Assam with 38.7 percent and Tamil Nadu with 29 percent. Tamil Nadu and Meghalaya also have high shares of female casual labour, 31.1 and 24.7 percent, respectively, but Assam only has 7.2 percent.
The four north-eastern states of Mizoram, Arunachal Pradesh, Manipur and Nagaland have the smallest shares of their workforces engaged in casual labour (5.1, 5.3, 5.5 and 5.5 percent, respectively). These states also have the lowest rates of casual labour in the rural sector—4.6, 5.3, 4.9 and 5.7 percent, respectively, and quite low shares in the urban sector as well—5.9, 5.2, 7 and 4.7 percent, respectively. Among all states, Manipur, Arunachal Pradesh, Mizoram and Nagaland also have the lowest shares of male casual labour—7.2, 7.9,8.3 and 8.8 percent, respectively. The female rates of casual labour in these states are 2.1, 1.8, 0.4 and 0.8 percent, respectively.
Self-employment
The category of self-employed people is further divided into three segments—employers (5.2 percent); “own-account workers” (63.9 percent); and unpaid helpers (29.1 percent). Own-account workers are those who operate their enterprises on their own or with a few partners, and who did not hire any labour during the reference period. Those who work on their own account with a few partners and hired labour are referred to as employers. Unpaid helpers are those who work in their household enterprises or help other persons living in the same household in running their own enterprises, and who do not receive regular wages or salaries.
Across India, over half of the workforce was self-employed in 2022-23. In Arunachal Pradesh, this share was significantly higher at 72.8 percent. Nearly half (49.9 percent) of its urban workforce and 76.2 percent of its rural workforce were self-employed. Arunachal Pradesh was followed by Manipur and Uttar Pradesh (68.3 and 68 percent, respectively). Goa, Kerala, Tamil Nadu and Punjab had the lowest shares of self-employed people (29.9, 33.7, 34.6 and 44.4 percent, respectively).
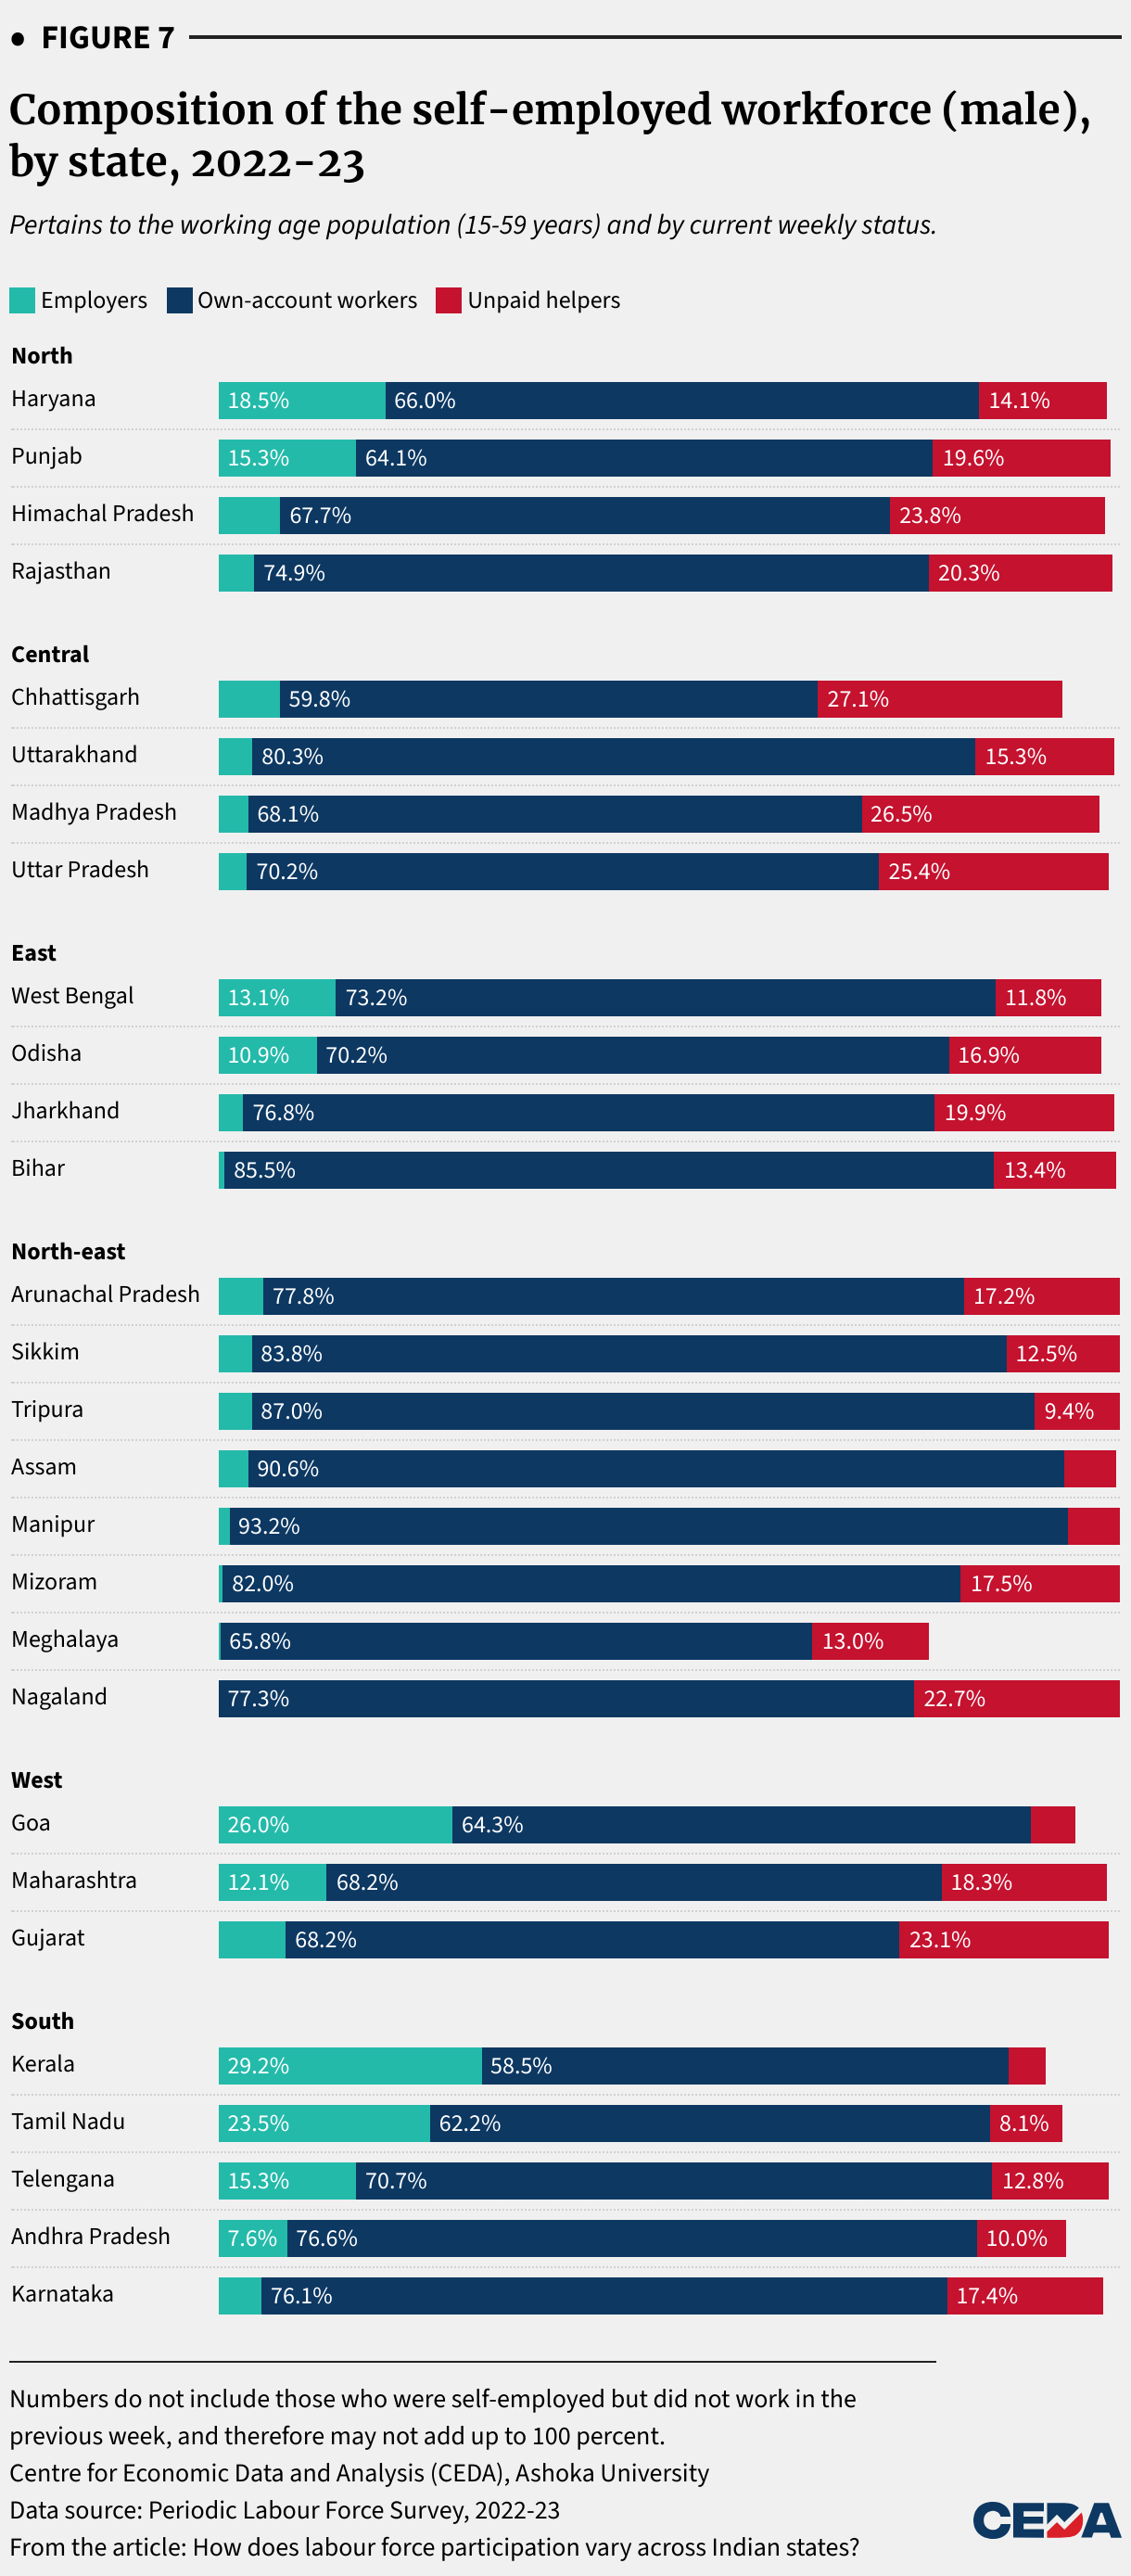
Goa tops the list of states with the highest share of self-employed people identified as employers – nearly a quarter (23 percent) of self-employed persons were employers. Kerala came a close second with 22 percent. This share was 29.9 and 14.1 percent 26 percent in urban and rural Goa respectively 26 percent and 19.1 percent respectively in rural and urban Kerala.
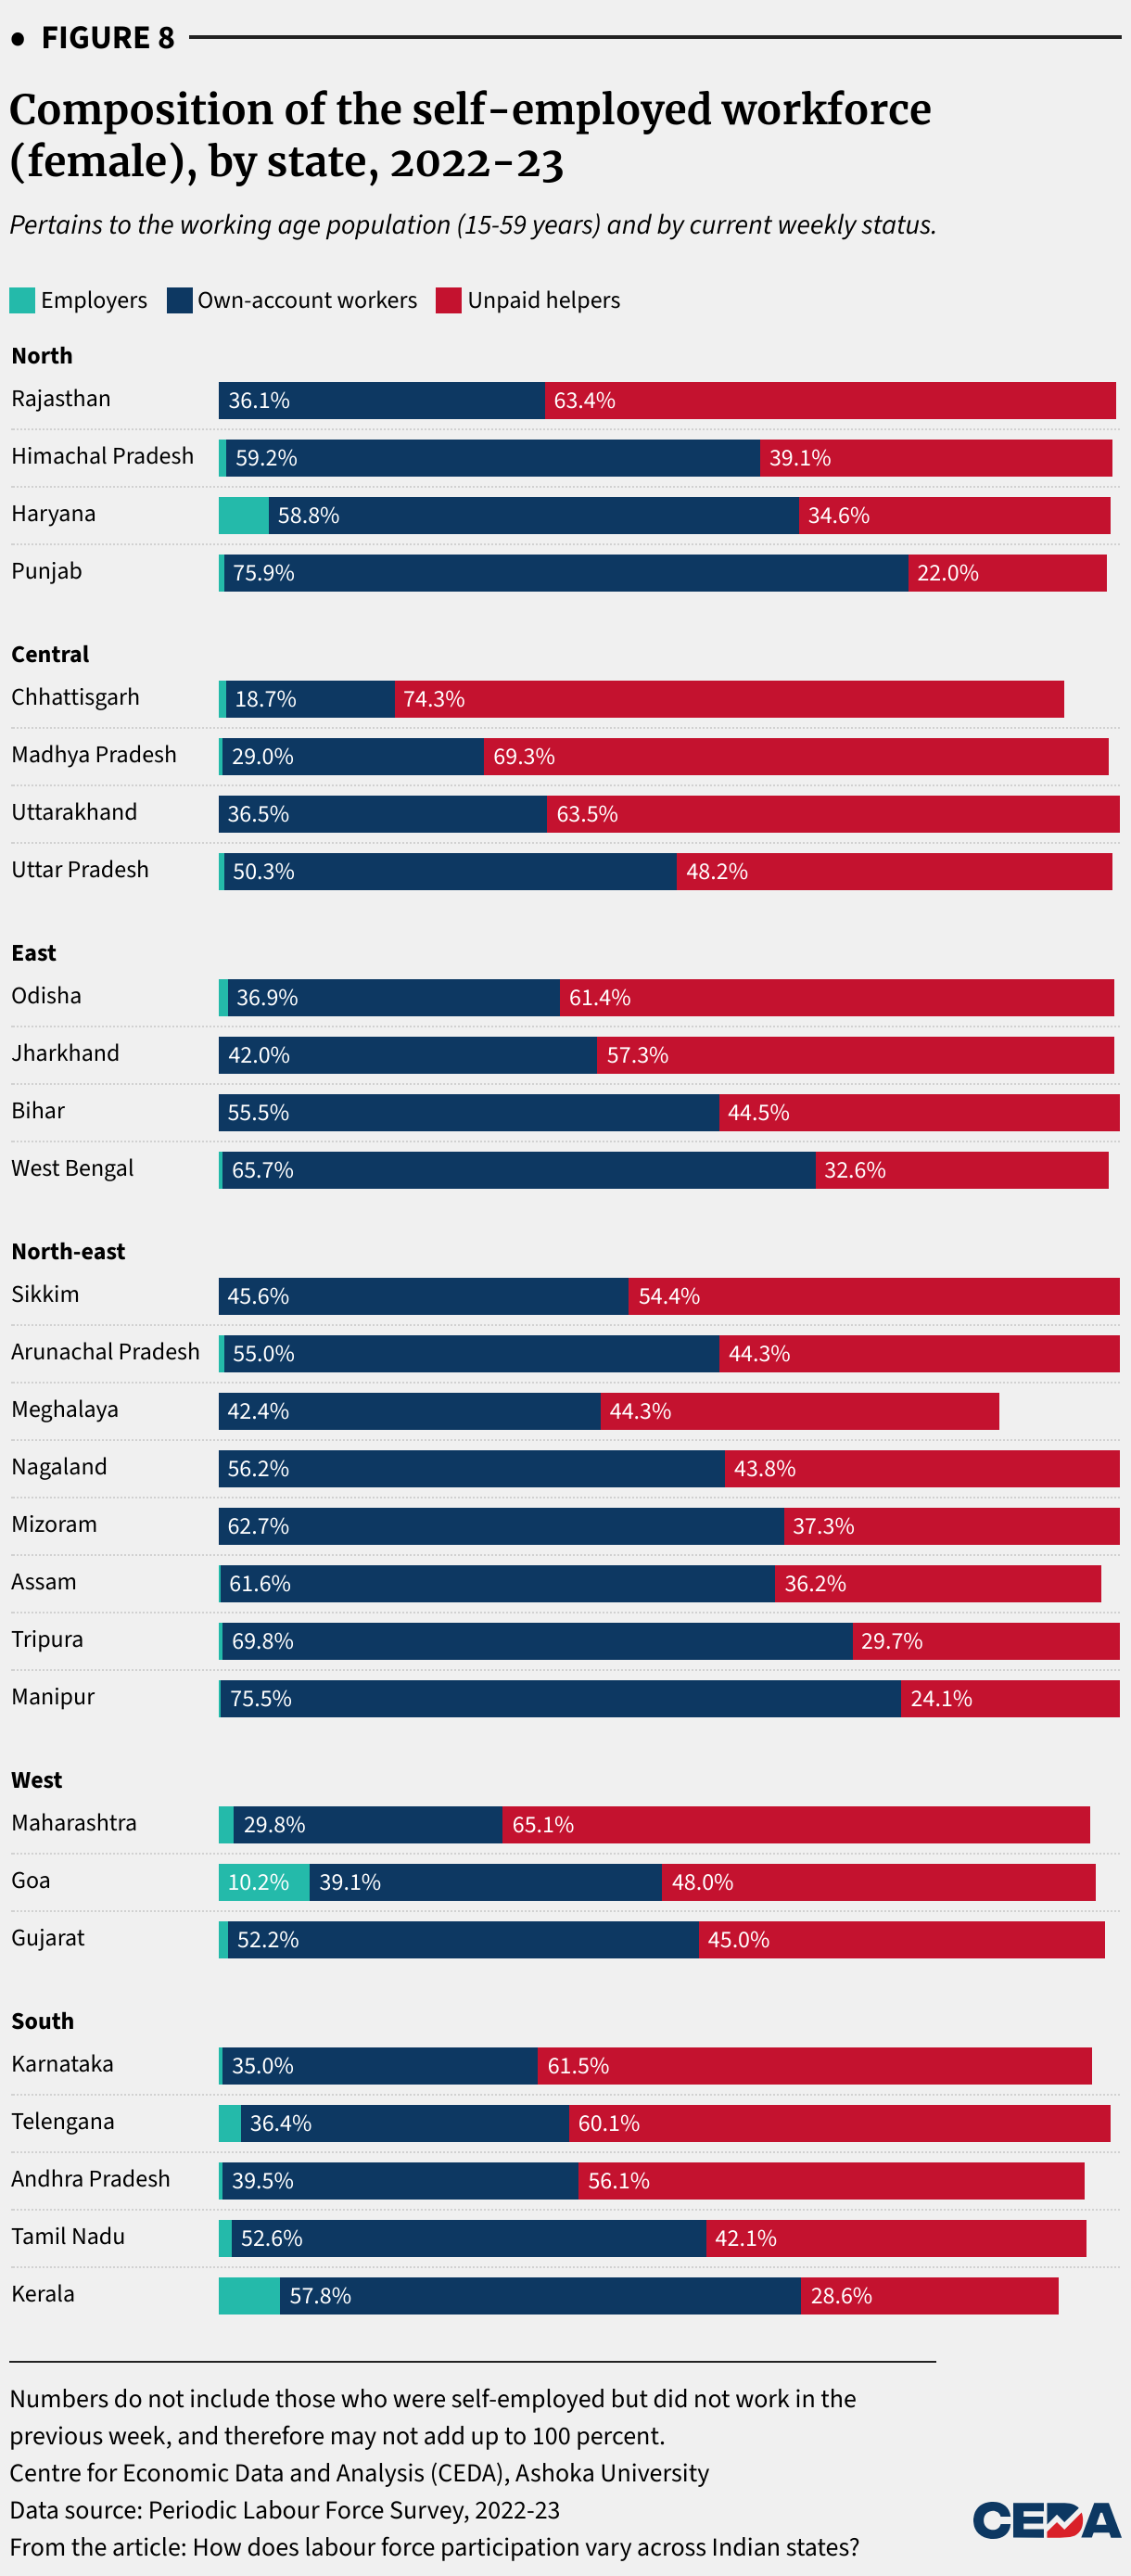
Across India, women are much less likely to be employers than men (only 0.9 percent of self-employed women were employers versus 7.4 percent men. This gender gap was prevalent in Goa and Kerala. Still, the share of self-employed women who were employers was the highest in Goa and second-highest in Kerala across all states (Figure 8).
Haryana and Tamil Nadu had the next highest shares of self-employed persons engaged as employers (15.5 and 15.2 percent), respectively. Nagaland, Meghalaya and Mizoram had the lowest shares (0, 0.1 and 0.2 percent, respectively).
Chhattisgarh had the highest proportion of unpaid helpers in 2022-23 (45.5 percent), with this share being higher in rural parts (47.3 percent) than urban areas (29.5 percent). But wide gender gaps persisted – 74.3 percent for women versus 27.1 percent for men. Chhattisgarh was followed by Madhya Pradesh and Rajasthan with 40.4 percent and 37.9 percent of their self-employed workforces engaged as unpaid helpers, respectively.
On the other side of the spectrum, Assam had the lowest share of unpaid helpers at 11.5 percent, followed by Kerala and Manipur with 12.0 and 12.4 percent, respectively.
The share of self-employed persons working as own-account workers remained over 40 percent in all states. Manipur led this list with 86.7 percent, followed by Assam (85.1 percent) and Tripura (81.1 percent). These trends look very different from a gender lens. Punjab had the highest share of self-employed women working as own-account workers (75.9 percent). Manipur was second with 75.5 percent. Previous research on Manipur has noted household enterprises being common in the state and more women being part of the workforce due to greater freedom and lesser discrimination. Chhattisgarh has the lowest (18.7 percent) share of female own-account workers. Among self-employed men, the highest share of own-account workers was in Manipur (93.2 percent), and the lowest in Kerala (58.5 percent).
However, an increase in entrepreneurship in the form of self-employment and own-account work may not be indicative of welfare. Banerjee and Duflo note that entrepreneurship is common among the poor, and that this may be an attempt to raise capital, carry out investment and subsequently be the “full residual claimant for the resulting earnings”. Moreover, poor families tend to have multiple occupations, especially in rural areas. This might explain the rise of self-employment and own-account work in some states like Assam and Tripura and the decline in wage and salaried employment. An increase in self-employment and own account work, therefore, may hint at the worsening situation of poverty in these states and not be an indicator of prosperity.
If you wish to republish this article or use an extract or chart, please read CEDA’s republishing guidelines.
Related posts
 How labour force participation rates in India vary across age groups
 Decoding women’s labour force participation in 2021-22: What the Periodic Labour Force Survey shows
 Illusory or real? Unpacking the recent increase in women’s labour force participation in India
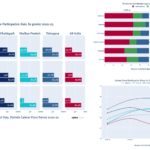 Assembly Elections 2023: Unravelling patterns of labour force participation in the five states
 Daily status, weekly status, usual status: Why labour force participation rates vary by reference period